The Latest in Mortgage News: Ontario Teachers’ Pension Plan to Buy HomeEquity Bank

General Beata Gratton 23 Sep

The Latest in Mortgage News: Ontario Teachers’ Pension Plan to Buy HomeEquity Bank

The Ontario Teachers’ Pension Plan Board has taken a major investment stake in Canada’s rapidly growing reverse mortgage market with its acquisition of HomeEquity Bank.

Ontario Teachers’, the largest single-profession pension plan in Canada with over $227 billion in assets, announced Wednesday it has entered into an agreement to purchase Birch Hills Equity Partners Management, parent company of HomeEquity Bank.

HomeEquity Bank is Canada’s largest reverse mortgage lender with a 30-year history of helping Canadians access the equity in their homes.

“HomeEquity Bank is an excellent fit for our growing portfolio of leading financial services firms,” Karen Frank, Senior Managing Director of Equities at Ontario Teachers’, said in a release. “We believe the company has a high-quality management team, a solid value proposition for consumers and room to grow their business given Canada’s aging population as well as the increased attractiveness of staying in your own home as you age.”

HomeEquity, like its key competitor Equitable Bank, has enjoyed strong growth in recent years as more seniors rely on rising home valuations to support them in their retirement years. In 2020, HomeEquity completed a record $830 million in reverse mortgage originations, marking a 39% increase over the previous three years.

As of June 2021, the bank had more than $5 billion of reverse mortgages under administration.

“This record-setting growth demonstrates the appetite for reverse mortgage products is growing as millions of homeowners 55 and older are recognizing the tremendous value and flexibility they provide,” Steven Ranson President and CEO of HomeEquity Bank, said in a statement this summer.

The bank’s research found more than a quarter of homeowners 55-plus would consider tapping into their home’s equity to help fund their retirement. As a result, the reverse mortgage market in Canada is expected to grow by another $1 billion in 2021 alone.

There will be no immediate impact on day-to-day operations through the transition, and no changes to the bank’s existing relationships or contracts, said Yvonne Ziomecki, EVP and Chief Marketing Officer at HomeEquity Bank.

“Ontario Teachers’ has a long history of investing in successful financial services businesses in Canada and internationally and we look forward to supporting HomeEquity Bank during its next stage of growth,” Frank added.

BMO, National Bank Lower 5-year Fixed Rates

BMO and National Bank of Canada are the latest of the Big 6 banks to cut mortgage rates.

The moves follow last week’s rate cuts announced by RBC, TD, CIBC and HSBC.

According to data from RateSpy.com, BMO has cut its uninsured 5-year fixed rate by 25 basis points to 2.19%, and its 5-year fixed insured (high ratio) rate by 35 bps to 1.99%.

National Bank of Canada, meanwhile, dropped its uninsured 5-year fixed special-offer rate by 5 bps to 2.39%.

Of the Big 6 banks, TD currently is currently advertising the lowest 5-year insured fixed rate at 1.89%.

Elevated Inflation Could Persist Up to Two Years: BMO Economics

Upward pressure from wages, along with home, food and energy prices, could keep Canada’s inflation rate elevated at 3% over the next two years, according to analysis from BMO Economics.

The first stage of inflation, the “extreme base effects and the reopening bounces,” were like the “booster rocket that is now falling away,” wrote Douglas Porter, BMO’s Chief Economist.

However, “the potential second-stage rockets are all staring us in the face,” he added.

Those more lingering effects could come from three sources, Porter explained:

  • Wage pressure: 41% of small businesses are reporting rising wages with 28% saying quality of labour is their biggest issue.
  • High home prices: home prices take 12 to 18 months to start impacting the Consumer Price Index, and account for nearly one-quarter of the index.
  • Strength of energy and food prices: this is partly being impacted by extreme weather.

“…if you are looking for soothing words on inflation, probably best not to approach us—similar to the U.S., our calls are at the high end of consensus, with headline Canadian CPI to average roughly 3% this year and next,” Porter wrote. “Canada has not seen a single year with an average inflation rate of 3% or higher since 1991, let alone two years in succession.”
Home Prices Post Monthly Gain as Supply Tightens

General Beata Gratton 16 Sep

Home Prices Post Monthly Gain as Supply Tightens

National home prices posted their first monthly increase since February as housing inventory tightened further to “extremely low” levels, the Canadian Real Estate Association reported.

The average selling price in August was $663,500, up 13.3% year-over-year and a 0.5% increase from July, ending a four-month streak of monthly price declines.

Since the March peak, average prices have fallen 7.4%. Removing the high-priced markets of the Greater Toronto and Vancouver areas, the average price stands at $533,500.

There were 50,876 home sales in August, down 14% from a year earlier, but still the second-best August result in history, CREA noted.

“Canadian housing markets appear to be stabilizing somewhere in between pre- and peak-pandemic levels—which is to say, still extremely unbalanced,” said Shaun Cathcart, CREA’s Senior Economist.

Housing Inventory Remains “Extremely Low”

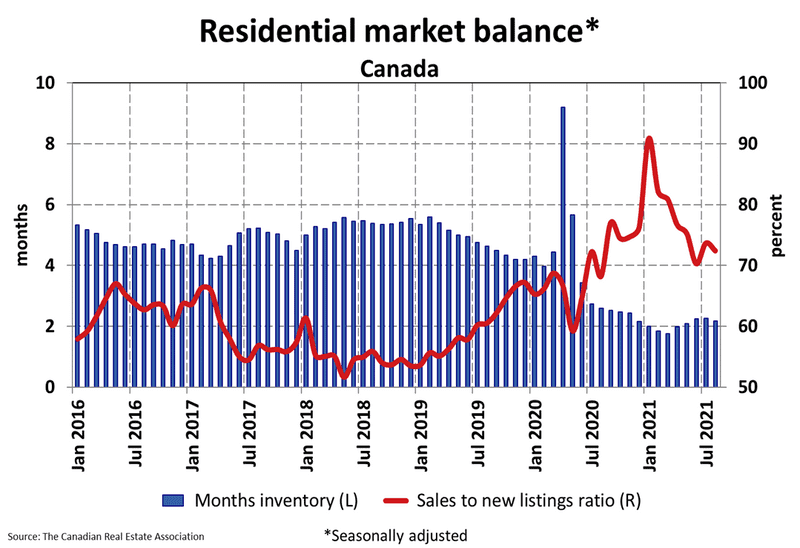
Already near a historical low, housing inventory ticked down to 2.2 months in August. Housing inventory is the amount of time it would take to liquidate current inventories at today’s rate of sales.

“This is extremely low–still indicative of a strong seller’s market at the national level and in most local markets,” CREA noted. “The long-term average for this measure is more than twice where it stands today.”

For housing analyst Ben Rabidoux, President of North Cove Advisors, the dramatic fall in supply is the big story in Canadian housing market.

“We’ve gotten inventory levels that are down 60% nationally from 2015 levels,” he said during a recent webinar hosted by Mortgage Professionals Canada. “Just an absurd relentless decline, and that is the story of Canadian housing right now.”

Rabidoux noted that inventory levels would need to more than double or home sales would have to fall in half—or some combination of both—before we see prices start to fall.

“We are so far from a balanced housing market that we can double supply and still be in a seller’s market,” he said. “So, we have a chronic shortage of supply.”

Residential market balance_CREA

Cross-Country Roundup of Home Prices

Here’s a look at some more regional and local housing market results for August:

  • Ontario: $834,932 (+15.1%)
  • Quebec: $451,904 (+14.7%)
  • B.C.: $899,173 (+16.8%)
  • Alberta: $417,321 (+4.2%)
  • Barrie & District: $739,200 (+35%)
  • Greater Montreal Area: $497,800 (+21.7%)
  • Victoria: $854,300 (+19.8%)
  • Halifax-Dartmouth: $442,284 (+19%)
  • Ottawa: $653,200 (+18.5%)
  • Greater Toronto Area: $1,059,200 (+17.4%)
  • Greater Vancouver Area: $1,176,600 (+13.2%)
  • Winnipeg: $318,900 (+11.6%)
  • Calgary: $446,500 (+10%)
  • St. John’s: $286,200 (+7.6%)
  • Edmonton: $343,100 (+5.8%)

CREA Lowers its Home Sales Forecast, Raises Price Expectations

Due to the tight supply conditions and rising home prices, the Canadian Real Estate Association unveiled an updated forecast for the year.

It now expects 656,300 homes to exchange hands in 2021, a jump of roughly 19% from 2020, but down slightly from its previous forecast of 682,900.

Looking ahead to 2022, home sales are expected to fall 12.1% to 577,000 units.

“Limited supply and higher prices are expected to tap the brakes on activity in 2022 compared to 2021, although increased churn in resale markets resulting from the COVID-related shake-up to so many people’s lives may continue to boost activity above what was normal before COVID-19,” CREA noted.

The association also bumped up its home price forecast for 2021 to $680,000, a 19.9% increase from 2020. It had previously forecast an average selling price of $678,000 for 2021.

Prices are expected to continue to rise in 2022 to an average of $718,000, up 5.6% on an annual basis.

Steve Huebl

Annual Inflation In August Rises to 4.1% in Canada–But Are We Close To The Peak?

General Beata Gratton 16 Sep

Annual Inflation In August Rises to 4.1% in Canada–But Are We Close To The Peak?


Today’s release of the August Consumer Price Index (CPI) for Canada posted another uptick in the year-over-year (y/y) inflation rate, but hidden in the details was some support for the Bank of Canada’s position that the spike in inflation is transitory. The Bank has long suggested that the rise in prices will prove to be the result of base effects (y/y comparisons that are biased upward by the temporary decline in prices one year ago), supply disruptions, and the surge in pent-up demand accompanying the reopening of the global economy.

This morning’s Stats Canada release showed that consumer price inflation surged to a 4.1% y/y pace last month, above the 3.7% pace recorded in June, and the 3.1% pace in May. This is now the fifth consecutive month in which inflation is above the 1%-to-3% target band of the Bank of Canada.

The good news, however, is that the monthly rise in prices slowed on a (seasonally adjusted basis) in August to 0.4% compared to the 0.6% rise in July. As well, core measures of inflation preferred by the Bank of Canada, which exclude food and energy, are considerably lower than the all-items measures of the CPI. All three of the BoC’s core inflation measures rose on a y/y basis last month to an average level of 2.6% vs. the all-items level of 4.1%.


The major contributors to the surge in inflation didn’t change in August. Gasoline prices rose a whopping 32.5% y/y, owing to production cuts and disruptions in the wake of Hurricane Ida. This more than offset the decline in demand due to the rise in the Delta variant, causing a sharp slowdown in China and other hard-hit regions. The homeowners’ replacement cost index, related to the price of new and existing homes, rose to 14.3% in August–the largest annual increase since September 1987. Similarly, the other owned accommodation expenses index, which includes commission fees on the sale of real estate, rose 14.3% year over year in August. The easing of travel restrictions boosted demand for airfares and hotel accommodation when labour shortages and rising energy costs pressed these industries. Meat prices have also surged in the past year as restaurant demand spiked. Auto sector prices continued to rise sharply as the inventories of new vehicles, disrupted by the chip shortage, hit new record lows.

Bottom Line

As the first chart below shows, the US has posted the highest level of inflation in the G-7, as the economic rebound there has outpaced that of its counterparts where Covid restrictions were more pervasive. Yet, yesterday’s release of the US August CPI report showed a marked slowdown in inflation pressure, leading some to suggest that the transitory view of inflation has been validated.

One thing to watch, however, is wage rates. Job vacancies and labour shortages have pushed up wages in some sectors, especially in the hardest-hit low-wage hospitality and leisure sectors, including food services and accommodation. If price pressures become validated by enough wage inflation, we run the risk of inflation becoming embedded. Wage-price spiraling has not been a factor since the 1970s when labour unions were much stronger and labour had much more pricing power.

Financial markets appear to be sanguine about the prospect for inflation-induced rate hikes in the near term. Bond yields remain historically low. Next week, we will hear more from the Fed on this subject as the policy-making group releases its report on Wednesday, September 22.

Dr. Sherry Cooper

Home Prices Still Rising As Falling Sales Reflect Insufficient Supply

General Beata Gratton 15 Sep

Home Prices Still Rising As Falling Sales Reflect Insufficient Supply


Today the Canadian Real Estate Association (CREA) released statistics showing national existing home sales fell a slight 0.5% nationally from July to August 2021–the fifth consecutive monthly decline. Over the same period, the number of newly listed properties edged up 0.8%, and the MLS Home Price Index rose 0.9% m/m bringing the year-over-year (y/y) rise to 21.3%. Transactions appear to be stabilizing at a more sustainable, but still strong level (see chart below).

Small declines in the GTA and Montreal were offset by gains in the Fraser Valley, Quebec City and Edmonton.

The actual (not seasonally adjusted) number of transactions in August 2021 was down 14% on a year-over-year basis from the record set for that month last August. That said, it was still the second-best month of August in history.


New Listings

The number of newly listed homes ticked 1.2% higher in August compared to July. As with sales activity, it was a fairly even split between markets that saw declines and gains. New supply declines in the GTA and Ottawa were offset by gains in Vancouver and Montreal among bigger Canadian markets.

With both sales and new listings relatively unchanged in August, the sales-to-new listings ratio remained a tight 72.4% compared to 73.6% in July. The long-term average for the national sales-to-new listings ratio is 54.7%.

Based on a comparison of sales-to-new listings ratio with long-term averages, a small majority of local markets remain in seller’s market territory. The remainder are in balanced territory.

There were 2.2 months of inventory on a national basis at the end of August 2021, down a bit from 2.3 months in July. This is extremely low – still indicative of a strong seller’s market at the national level and most local markets. The long-term average for this measure is more than twice where it stands today. It was also the first time since March that this measure of market balance tightened up.


Home Prices

The Aggregate Composite MLS® Home Price Index (MLS® HPI) rose 0.9% month-over-month in August 2021. In line with tighter market conditions, this was the first acceleration in month-over-month price growth since February. While the trend of re-accelerating prices was first observed earlier this summer in Ontario, the reversal at the national level in August was less of a regional story and more of a critical mass story. Synchronous trends across the country have been the defining feature of the housing story since COVID-19 first hit, and that still appears to be the case.

The non-seasonally adjusted Aggregate Composite MLS® HPI was up 21.3% on a year-over-year basis in August.

Looking across the country, year-over-year price growth is averaging around 20% in B.C., though it is lower in Vancouver, a bit lower in Victoria, and higher in other parts of the province. Year-over-year price gains are in the mid-to-high single digits in Alberta and Saskatchewan, while gains were a little over 10% in Manitoba.

Ontario saw year-over-year price growth still over 20% in August. However, as with B.C. big, medium and smaller city trends, gains are notably lower in the GTA, around the provincial average in Oakville-Milton, Hamilton-Burlington and Ottawa, and considerably higher in most smaller markets in the province.

The opposite is true in Quebec, where Greater Montreal’s year-over-year price growth, at a little over 20%, is almost double that of Quebec City. Price growth is running a little above 30% in New Brunswick (higher in Greater Moncton, a little lower in Fredericton and Saint John), while Newfoundland and Labrador is in the 10% range on a year-over-year basis (a bit lower in St. John’s).


Bottom Line

Local housing markets are cooling off as prospective buyers contend with a dearth of homes for sale. Though increasing vaccination rates have begun to bring a return to normal life in Canada, that’s left the country to contend with one of the developed world’s most severe housing shortages and little prospect of much new supply becoming available soon despite all of the election promises. As net new immigration resumes, this excess demand in housing will mount. The impediments to a rapid rise in housing supply, both for rent and purchase, are primarily in the planning and approvals process at the municipal levels. Federal election promises do not address these issues.

Dr. Sherry Cooper

August Employment Report Showed Continuing Recovery

General Beata Gratton 13 Sep

August Employment Report Showed Continuing Recovery


This morning, Statistics Canada provided us with some much-needed good news on the economic front following last week’s surprisingly dismal Q2 GDP report. Canada’s labour market continued its recovery in August, especially in the hardest-hit food services and accommodation sectors. The August Labour Force Survey (LFS) data reflect conditions during the week of August 15 to 21. By then, most regions of Canada had lifted many of the Covid-related restrictions. However, there were capacity restrictions in such indoor locations as restaurants, gyms, retail stores and entertainment venues. Also, for the first time since March 2020, border restrictions were lifted for fully vaccinated non-essential travellers from the US.

However, the reopening of the Canadian economy has been creaky, owing to supply constraints and difficulty in filling job vacancies in sectors that require high-contact interfaces, especially with the concern regarding a fourth wave of the delta variant. Nevertheless, today’s LFS indicated that employment grew last month by 90,200, the third consecutive monthly gain, further closing the pandemic gap. Employment is now within 156,000 (-0.8%) of its February level, the closest since the onset of the pandemic. Moreover, most of the net new jobs were in full-time work. Increases were mainly in the service sector, led by accommodation and food services.


The jobless rate fell from 7.5% in July to 7.1% in August. The unemployment rate peaked at 13.7% in May 2020 and has trended downward since, despite some short-term increases during the fall of 2020 and spring of 2021. In the months leading up to the pandemic, the unemployment rate had hovered around historic lows and was 5.7% in February 2020.

The adjusted unemployment rate—which includes discouraged workers–those who wanted a job but did not look for one—was 9.1% in August, down 0.4 percentage points from one month earlier.

Employment increased in Ontario, Alberta, Saskatchewan and Nova Scotia in August. All other provinces recorded little or no change. For the third consecutive month, British Columbia was the lone province with employment above its pre-pandemic level. Compared with February 2020, the employment gap was largest in Prince Edward Island (-3.4%) and New Brunswick (-2.7%). The table below shows the jobless rates by province.


Bottom Line 

The Bank of Canada this week once again suggested that it would not begin to tighten monetary policy until the economy returned to full capacity utilization, which they estimate will not be until at least the second half of next year. Employment will need to surpass pre-pandemic levels before complete recovery is declared because the population had grown since the start of the crisis 18 months ago.

Although August was another solid month for the jobs market, there is a wide disparity across sectors of the job market in the degree to which they have recovered from the effects of the pandemic. The table below shows the employment change in percentage terms by sector compared with February 2020.

Sectors where remote work has been widespread–such as professional, scientific and technical services, public administration, finance, insurance and real estate–have seen a net gain in employment. However, in high-touch sectors that were deemed nonessential, the jobs recovery has been far more constrained. This is especially true in agriculture, accommodation and food services, and recreation.


Dr. Sherry Cooper

Bank of Canada Responds To Weak Q2 Economy–Holding Policy Steady

General Beata Gratton 9 Sep

Bank of Canada Responds To Weak Q2 Economy–Holding Policy Steady


As we await the quarterly economic forecast in next month’s Monetary Policy Report, the Bank of Canada acknowledged that the Q2 GDP report, released last week, caught them off-guard. In today’s policy statement, the Governing Council of the Bank said, “In Canada, GDP contracted by about 1 percent in the second quarter, weaker than anticipated in the Bank’s July Monetary Policy Report (MPR). This largely reflects a contraction in exports, due in part to supply chain disruptions, especially in the auto sector. Housing market activity pulled back from recent high levels, largely as expected. Consumption, business investment and government spending all contributed positively to growth, with domestic demand growing at more than 3 percent. Employment rebounded through June and July, with hard-to-distance sectors hiring as public health restrictions eased. This is reducing unevenness in the labour market, although considerable slack remains and some groups – particularly low-wage workers – are still disproportionately affected. The Bank continues to expect the economy to strengthen in the second half of 2021, although the fourth wave of COVID-19 infections and ongoing supply bottlenecks could weigh on the recovery” (see chart below).


Bank Says CPI Inflation Boosted By Temporary Factors–Maybe

Financial conditions remain highly accommodative around the globe. And the Bank today continued to assert that the rise in inflation above 3% is expected, “boosted by base-year effects, gasoline prices, and pandemic-related supply bottlenecks. These factors pushing up inflation are expected to be transitory, but their persistence and magnitude are uncertain and will be monitored closely. Wage increases have been moderate to date, and medium-term inflation expectations remain well-anchored. Core measures of inflation have risen but by less than the CPI.”

The Governing Council again stated the Canadian economy still has considerable excess capacity, and the recovery continues to require extraordinary monetary policy support. “We remain committed to holding the policy interest rate at the effective lower bound until economic slack is absorbed so that the 2 percent inflation target is sustainably achieved.” Concerning forward guidance, the Bank said, “We remain committed to holding the policy interest rate at the effective lower bound until economic slack is absorbed so that the 2 percent inflation target is sustainably achieved. In the Bank’s July projection, this happens in the second half of 2022.” This seems to be a placeholder statement, allowing the Bank to reassess the outlook next month, possibly delaying the guidance if the economy continues to perform below their July projection.

Similarly, the Bank maintains its Quantitative Easing program at the current pace of purchasing $2 billion per week of Government of Canada (GoC) bonds, keeping interest rates low across the yield curve. “Decisions regarding future adjustments to the pace of net bond purchases will be guided by Governing Council’s ongoing assessment of the strength and durability of the recovery. We will continue to provide the appropriate degree of monetary policy stimulus to support the recovery and achieve the inflation objective”.

Bottom Line

Only time will tell if the Bank of Canada is correct in believing that inflation pressures are temporary. Financial markets will remain sensitive to incoming data, but bond markets seem willing to accept their view for now. The 5-year GoC bond yield has edged down from its recent peak of 1.0% posted on June 28th to a current level of .80%. In contrast, the Canadian dollar had weakened significantly since late June when it was over US$0.825 to US$0.787 this morning. Clearly, the Bank of Canada is committed to keeping Canadian interest rates low for the foreseeable future.

The next Bank of Canada policy decision date is October 27th. Stay tuned for the Canadian employment report this Friday.

Dr. Sherry Cooper