Fixed Mortgage Rates Set to Climb Higher as Bond Yields Take Off

General Beata Wojtalik 27 Oct

Fixed Mortgage Rates Set to Climb Higher as Bond Yields Take Off

Bond yields rocketed higher following today’s Bank of Canada rate decision, making it likely that fixed mortgage rates will continue to rise.

The Bank acknowledged growing inflation concerns, saying the factors pushing prices up are “stronger and more persistent than expected.”

“The Bank is closely watching inflation expectations and labour costs to ensure that the temporary forces pushing up prices do not become embedded in ongoing inflation,” the BoC noted in its rate decision statement.

The Government of Canada 5-year bond yield jumped more than 10 basis points shortly after the announcement, to around 1.43%, before falling back slightly to 1.40%.

The 5-year bond yield, which leads 5-year fixed mortgage rates, is now up over a full percentage point since September 2020.

Oct 2021 5yr bond yield chart


Fixed rates have already been rising steadily over the past few weeks, and observers say they are likely to take another leg up.

In a tweet, Ron Butler of Butler Mortgage wrote that fixed mortgage rates will be going up again. “Starting Friday, big banks will continue to move fixed rates, likely about 30 bps by the time the dust settles next Friday.”

He added that the growing spread between fixed and variable rates will continue to drive borrowers towards variable rate mortgages.

“The last time 5-year bond yields were this high, deep-discounted 5-year fixed mortgage rates were in the 2.70% range,” housing analyst Ben Rabidoux, founder of Edge Realty Analytics, wrote in his latest report. “That implies about 60 bps of hikes are coming in the next few weeks unless bond yields reverse course.”

Rabidoux explained that the Bank’s recent slowdown in bond purchases, and announcement today that it will end its quantitative easing program altogether, “means that we’ll lose the artificial downward pressure on bond yields going forward,” since that program “had the explicit goal of pushing interest rates lower than they otherwise might be.”

As for variable rates, which are tied to prime rate, which in turn is influenced by the Bank of Canada’s overnight target rate, they could start rising earlier than expected as well.

In the BoC’s statement today, it changed its forward guidance, saying for the first time it could start hiking rates “sometime in the middle quarters of 2022.”

Markets, however, think it could happen even sooner than that, pricing in the first BoC rate hike as early as March. They also see six to seven quarter-point hikes over the next 36 months.

“An April start to tightening looks increasingly likely as long as we see continued progress in the economic and labour market recovery over the next six months,” wrote RBC economist Josh Nye. “Today’s messaging doesn’t go quite as far as the 100 bps of tightening by the end of next year markets were pricing in ahead of the meeting, though the move higher in bond yields and the Canadian dollar shows investors see some validation of that view.”

The Bank of Canada’s Latest Forecasts

Here’s are the key takeaways from the Bank’s rate decision and latest Monetary Policy Report (MPR):

Overnight rate:

  • Left unchanged at 0.25%, where it’s been since March 2020.

Quantitative Easing

  • The Bank ended its QE (bond-buying) program, as expected.
  • The Bank said it will move to a reinvestment phase, meaning, “we will purchase bonds only to replace those that are maturing so that our overall holdings of Government of Canada bonds remain roughly stable over time.”

Inflation

  • The bank expects consumer price index (CPI) inflation to average:
    • around 3.4% in 2021 (vs. 3% in its July forecast)
    • 3.4% in 2022 (vs. 2.4%)
    • 2.3% in 2023 (vs. 2.2%)
  • “The main forces pushing up prices—higher energy prices and supply bottlenecks—now appear stronger and more persistent than we previously thought,” the Bank said.

GDP forecast

  • The Bank now expects annual economic growth of:
    • 5.1% for 2021 (vs. 6% in its July forecast)
    • 4.3% in 2022 (vs. 4.6%)
    • 3.7% in 2023 (vs. 3.3%)

Steve Huebl

Prices are Rising Everywhere–Transitory Can Last A Long Time

General Beata Wojtalik 20 Oct

Prices are Rising Everywhere–Transitory Can Last A Long Time


Today’s release of the September Consumer Price Index (CPI) for Canada showed year-over-year (y/y) inflation rising from 4.1% in August to 4.4%, its highest level since February 2003. Excluding gasoline, the CPI rose 3.5% y/y last month.

The monthly CPI rose 0.2% in September, at the same pace as in the prior month. Month-over-month CPI growth has been positive for nine consecutive months.

Today’s inflation is a global phenomenon–prices are rising everywhere, primarily due to the interplay between global supply disruptions and extreme weather conditions. Inflation in the US is the highest in the G7 (see chart below). The economy there rebounded earlier than elsewhere in the wake of easier Covid restrictions and more significant markups.

Central banks generally agree that the surge in inflation above the 2% target levels is transitory, but all now recognize that transitory can last a long time. Bank of Canada Governor Tiff Macklem acknowledged that supply chain disruptions are “dragging on” and said last week high inflation readings could “take a little longer to come back down.”


Prices rose y/y in every major category in September, with transportation prices (+9.1%) contributing the most to the all-items increase. Higher shelter (+4.8%) and food prices (+3.9%) also contributed to the growth in the all-items CPI for September.

Prices at the gas pump rose 32.8% compared with September last year. The contributors to the year-over-year gain include lower price levels in 2020 and reduced crude output by major oil-producing countries compared with pre-pandemic levels.

Gasoline prices fell 0.1% month over month in September, as uncertainty about global oil demand continued following the spread of the COVID-19 Delta variant (see charts below).


Bottom Line

Today’s CPI release was the last significant economic indicator before the Bank of Canada meeting next Wednesday, October 27. While no one expects the Bank of Canada to hike overnight rates next week, market-driven interest rates are up sharply (see charts below). Fixed mortgage rates are edging higher with the rise in 5-year Government of Canada bond yields. The right-hand chart below shows the yield curve today compared to one year ago. The curve is hinged at the steady 25 basis point overnight rate set by the BoC, but the chart shows that the yield curve has steepened sharply with the rise in market-determined longer-term interest rates.

Moreover, several market pundits on Bay Street call for the Bank of Canada to hike the overnight rate sooner than the Bank’s guidance suggests–the second half of next year. Traders are now betting that the Bank will begin to hike rates early next year. The overnight swaps market is currently pricing in three hikes in Canada by the end of 2022, which would bring the policy rate to 1.0%. Remember, they can be wrong. Given the global nature of the inflation pressures, it’s hard to imagine what tighter monetary policy in Canada could do to reduce these price pressures. The only thing it would accomplish is to slow economic activity in Canada vis-a-vis the rest of the world, particularly if the US Federal Reserve sticks to its plan to wait until 2023 to start hiking rates.

It is expected that the Bank will taper its bond-buying program once again to $1 billion, from the current pace of $2 billion.

The Bank will release its economic forecast next week in the Monetary Policy Report. It will need to raise Q3 inflation to 4.1% from its prior forecast of 3.9%.


Dr. Sherry Cooper

Canadian Home Prices Continued to Rise As Insufficient Supply Creates Excess Demand

General Beata Wojtalik 15 Oct

Canadian Home Prices Continued to Rise As Insufficient Supply Creates Excess Demand
Today the Canadian Real Estate Association (CREA) released statistics showing national existing-home sales rose 0.9% between August and September 2021, posting the first monthly gain since March (see chart below). On a year-over-year (y-o-y) basis, the number of transactions last month was down 17.5%. Nevertheless, it was still the second-highest sales figure ever for the month of September.

“September provided another month’s worth of evidence from all across Canada that housing market conditions are stabilizing near current levels,” said Cliff Stevenson, Chair of CREA. “In some ways that comes as a relief given the volatility of the last year-and-a-half, but the issue is that demand/supply conditions are stabilizing in a place that very few people are happy about. There is still a lot of demand chasing an increasingly scarce number of listings, so this market remains very challenging.”

Housing supply remains a major constraint, forcing many buyers to either pay up for scarce properties or to remain on the sidelines. This is particularly troublesome for first-time homebuyers as mortgage rates are coming under renewed upward pressure as inflation concerns have forced yield curves to steepen and longer-term bond yields to rise worldwide.

New ListingsExacerbating supply problems, the number of newly listed homes fell by 1.6% in September compared to August, as gains in parts of Quebec were swamped by declines in the Lower Mainland, in and around the GTA and in Calgary.

With sales up and new listings down in September, the sales-to-new listings ratio tightened to 75.1% compared to 73.2% in August. The long-term average for the national sales-to-new listings ratio is 54.8%.

Based on a comparison of sales-to-new listings ratio with long-term averages, a small but growing majority of local markets are moving back into seller’s market territory (see chart below). As of September, it was close to a 60/40 split between seller’s and balanced markets.

There were 2.1 months of inventory on a national basis at the end of September 2021, down slightly from 2.2 months in August and 2.3 months in June and July. This is extremely low and indicative of a strong seller’s market at the national level and in most local markets. The long-term average for this measure is more than 5 months.

Home PricesIn line with tighter market conditions, the Aggregate Composite MLS® Home Price Index (MLS® HPI) accelerated to 1.7% on a month-over-month basis in September 2021.

The non-seasonally adjusted Aggregate Composite MLS® HPI was up 21.5% on a year-over-year basis in September, up a bit from the 21.3% year-over-year gain recorded in August.

Looking across the country, year-over-year price growth is creeping up above 20% in B.C., though it is lower in Vancouver (13.9%), on par with the provincial number in Victoria, and higher in other parts of the province (see table below).

Year-over-year price gains are in the mid-to-high single digits in Alberta and Saskatchewan, while gains are into the low double digits in Manitoba.

Ontario saw year-over-year price growth pushing 25% in September; however–as with B.C.–big, medium and smaller city trends, gains are notably lower in the GTA (19.0%) and Ottawa (16.4%), around the provincial average in Oakville-Milton (26.9%), Hamilton-Burlington (26.5%) and Guelph (26.4%), and considerably higher in many of the smaller markets around the province.

Greater Montreal’s year-over-year price growth remains at a little over 20%, while Quebec City is now at 12.7%. Price growth is running a little above 30% in New Brunswick (higher in Greater Moncton, a little lower in Fredericton and Saint John), while Newfoundland and Labrador is now at 12% year-over-year (a bit lower in St. John’s).

Bottom Line

Canada continues to contend with one of the developed world’s most severe housing shortages. As our borders open to a resurgence of immigration, excess demand for housing will mount. The impediments to a rapid rise in housing supply, both for rent and purchase, are primarily in the planning and approvals process at the municipal level. Liberal Party election promises do not address these issues.

It is noteworthy that while Canada suffers one of the most acute housing shortages, housing affordability is getting worse in many OECD countries (see chart below).

Adding to the affordability problem, interest rates have bottomed as an inflation-induced selloff in bonds mount despite the assertion of most central banks that inflation is temporary. Very recently, Governor Tiff Macklem admitted that inflation is likely to remain a problem until the end of the year.

Some of the inflation is coming from disruptions on the supply side emanating from COVID-related disruptions, which may work themselves out in time. However, they’re still getting worse, and many suggest the timeline could be much longer than just this year. In addition, extreme weather events and climate change initiatives–both of which are more or less permanent–have also boosted inflation pressure. Consumer demand for goods and housing and business capital expenditures have surged in the face of labour shortages. Wage rates are beginning to rise. All of this has raised prices spilling into next year. Higher interest rates are likely sustainable even though the Bank of Canada and the Federal Reserve will likely hold overnight rates steady for the next year (see charts below).

Dr. Sherry Cooper

National Home Prices Rose in September as Supply Tightened

General Beata Wojtalik 15 Oct

National Home Prices Rose in September as Supply Tightened

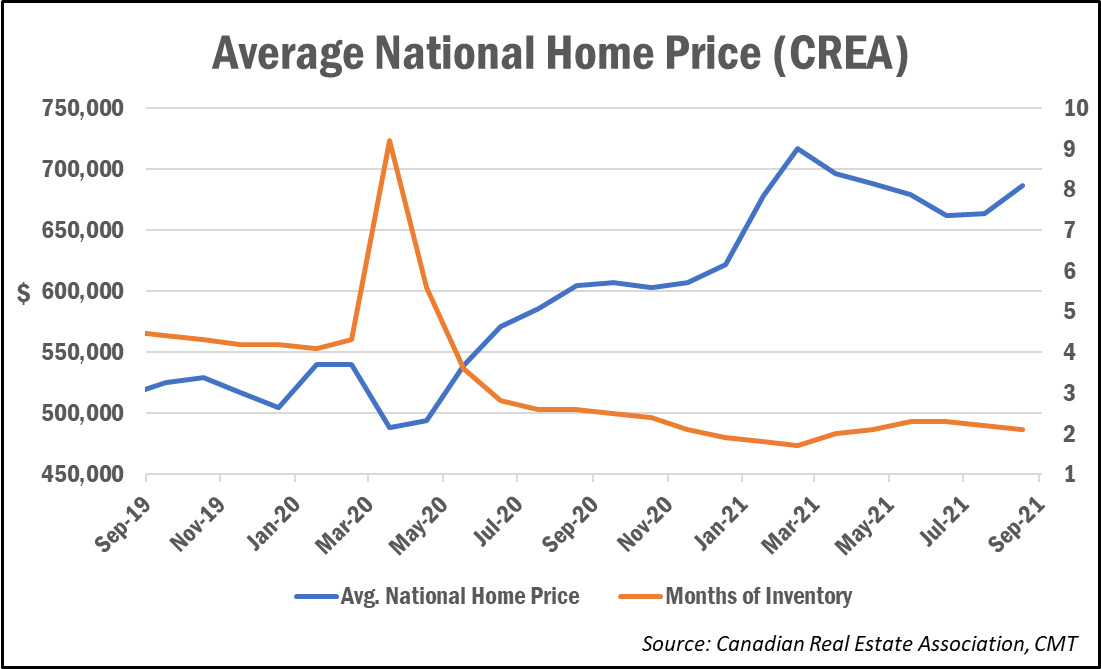
The national average home price re-accelerated in September, returning to a level last seen in May, while housing supply continued to trend down.

The average selling price in September was $686,650, up 13.9% year-over-year and 3.5% from July’s reading of $663,500.

Removing the high-priced markets of the Greater Toronto and Vancouver areas, the average price stands at $540,650.

There were 48,949 home sales in September, down 17.5% from a year earlier, but up 0.9% on a monthly basis, marking the first month-over-month increase since March, CREA noted.

Meanwhile, the tight supply conditions being seen across the country drove down the months of inventory measure to 2.1, well below the long-term average of roughly five months. New listings were also down 1.6% from July and 19.6% year-over-year.

Smaller changes in the monthly metrics suggest the market has now passed the period of extreme volatility seen since last spring, which was caused by the pandemic and related lockdowns, noted Shaun Cathcart, CREA’s senior economist.

“Having said that, given we are still stuck at around two months of inventory nationally, the thing to keep a close eye on going forward will be the behaviour of prices,” he said. “While the acceleration in home prices we saw in September was more than most would have expected, the fact that prices are now moving back in that direction is not surprising.”

Average National Home Price and Inventory


Cross-Country Roundup of Home Prices

Here’s a look at some more regional and local housing market results for August:

  • Ontario: $887,290 (+19.7%)
  • Quebec: $458,955 (+15.4%)
  • B.C.: $912,047 (+13.8%)
  • Alberta: $415,821 (+3.5%)
  • Barrie & District: $756,800 (+34.3%)
  • Halifax-Dartmouth: $471,746 (+22.9%)
  • Victoria: $861,900 (+21%)
  • Greater Montreal Area: $499,700 (+20.8%)
  • Greater Toronto Area: $1,082,400 (+19.1%)
  • Ottawa: $639,900 (+16.3%)
  • Greater Vancouver Area: $1,186,100 (+13.8%)
  • Winnipeg: $318,400 (+11.5%)
  • St. John’s: $291,100 (+9.6%)
  • Calgary: $443,700 (+9.2%)
  • Edmonton: $341,000 (+5.1%)

Looking Forward

All signs are pointing to more normalized readings in the months ahead, following what has been a turbulent and volatile 18 months for the housing market. This goes for both home sales and prices.

“The correction in sales from the unsustainable levels achieved earlier in the year is likely over, and September should mark the beginning of a modest positive trend in sales activity,” noted Rishi Sondhi, economist at TD Economics. “The key word here is modest, as interest rates are likely to grind higher moving forward, playing off against improving job markets, a rising population, and the decision by some households to plow excess savings into down payments.”

Sondhi added that federal housing policies could also provide some lift, but only to a small degree.

And where are home prices likely to go from here? Most signs are pointing up, say economists.

The market has remained tight in seven of the 10 provinces (all favourable to sellers) and more balanced in Alberta and Saskatchewan,” wrote economists at National Bank of Canada. “These market conditions should continue to support price increases in the coming months.”

Interest rates are also expected to play a greater role in regulating demand as we head closer to the start of the next rate-hike cycle.

“One can’t help but feel as though the Canadian housing market is walking on tinder again, with demand holding at historically high levels, listings getting quickly absorbed, and price growth running steady near a 20% pace,” wrote Robert Kavcic, senior economist at BMO Economics.

“That said, 5-year fixed mortgage rates likely face meaningful upside in the months ahead, which could act as a dampener,” he added. “If not, or if there is a heavy rotation to variable [rates] and the market starts to accelerate again from here, talk of earlier Bank of Canada moves will only grow louder.”

Steve Huebl

Sales Up in Most Cities with Busier Fall Homebuying Season Underway

General Beata Wojtalik 7 Oct

Sales Up in Most Cities with Busier Fall Homebuying Season Underway

Following a summer slowdown in home sales, activity started to pick up again in the country’s largest cities as the typically busier fall homebuying season kicked off in September.

Every year, we generally see an uptick in sales, average selling price and listings after Labour Day, and September 2021 was no different,” the Toronto Regional Real Estate Board (TRREB) said in its September report.

Compared to last year, market conditions tightened noticeably, with sales representing a substantially higher share of listings, and a significantly lower number of new listings across the board,” it added. “Resurgence in the condo market was a factor in the higher share of listings sold.”

Historically low housing supply continues to be a key factor in all markets that continues to apply upward pressure to prices.

Here’s a look at September readings from some of the country’s key real estate boards:

Greater Toronto Area

Sales: 9,046

  • -18% Year-over-year (YoY)
  • +5.2% Month-over-month (MoM)

Average Price: $1,136,280

  • +18.3% (YoY)
  • +6% (MoM)

New Listings: 13,483

  • -34% (YoY)
  • +27% (MoM)

“Demand has remained incredibly robust throughout September with many qualified buyers who would buy a home tomorrow provided they could find a suitable property,” said TRREB President Kevin Crigger. “With new listings in September down by one third compared to last year, purchasing a home for many is easier said than done. The lack of housing supply and choice has reached a critical juncture.”

Source: Toronto Regional Real Estate Board (TRREB)

Greater Vancouver Area

Sales: 3,149

  • -13.6% YoY
  • -0.1% MoM

Despite the decline from last year’s record figures, sales were still 20.8% above the 10-year average for September.

MLS Home Price Index for all property types: $1,186,100

  • +13.8% YoY
  • +0.8% MoM

New Listings: 5,171

  • -19.2% YoY
  • +28.2% MoM
  • New listings were 1.2% below the 10-year average for September.

“The summer trend of above-average home sales and historically typical new listings activity continued in Metro Vancouver last month,” said Keith Stewart, REBGV economist. “Although this is keeping the overall supply of homes for sale low, we’re not seeing the same upward intensity on home prices today as we did in the spring.”

Source: Real Estate Board of Greater Vancouver (REBGV)

Montreal Census Metropolitan Area

Sales: 3,671

  • -28% YoY
  • +8.9% MoM

Average Price (single-family detached): $504,500

  • +17% YoY
  • +0.9% MoM

Average Price (condo): $365,000

  • +15% YoY
  • -2.7% MoM

New Listings: 5,818

  • -20% YoY
  • +30% MoM

“The slowdown in residential sales to a pre-pandemic level continued in September,”said Charles Brant, director of the QPAREB’s Market Analysis Department. “A return to more normal economic activity resulting from the easing of health restrictions is not the only factor that explains this situation: in addition to high prices, the lack of properties for sale is still the main cause.”

Source: Quebec Professional Association of Real Estate Brokers (QPAREB)

Ottawa

Sales: 1,607

  • -31% YoY
  • +2.2% MoM

Average Price (single-family detached): $702,155

  • +13% YoY
  • +4% MoM

New Listings: 2,252

  • -22% YoY
  • +10.6% MoM

“While inventory has improved slightly from the pre-pandemic years (2017-2019), it is still the principal cause for concern with just over one month’s supply in the housing stock at this time,” said OREB President Debra Wright. “With the election behind us, we hope the government will now concentrate on addressing supply issues and developing first-time homebuyer assistance touted in their reelection platform.”

Source: Ottawa Real Estate Board (OREB)

Calgary

Sales: 2,159

  • +26.5% YoY

Average Price: $476,190

  • +1.8% YoY

New Listings: 2,907

  • +6.3% YoY

“The market continues to favour the seller, but conditions are not as tight as they were earlier this year,” said CREB chief economist Ann-Marie Lurie.

Source: Calgary Real Estate Board (CREB)

Steve Huebl