MAY SHOWS SIGNS OF IMPROVEMENT IN BC AND ALBERTA
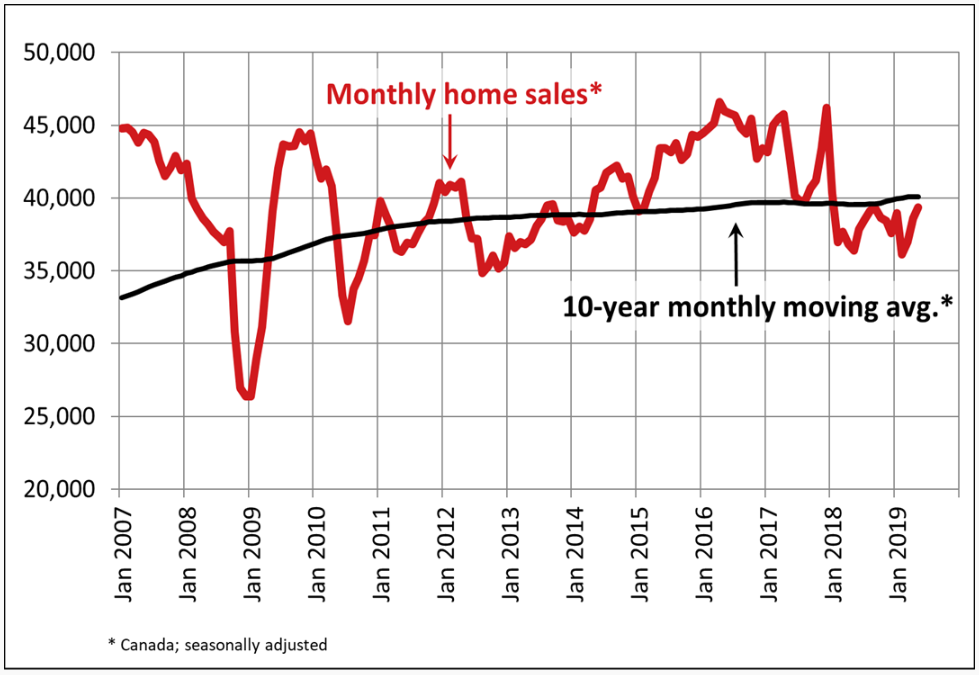
 Statistics released late last week by the Canadian Real Estate Association (CREA) show that national home sales increased in May. Together with monthly gains in the previous two months, activity in May reached its highest level since early last year when the new B-20 stress testing was introduced. While last month’s home sales stood 8.9% above the six-year low posted in February 2019, this latest uptick has only just returned May’s sales level to its 10-year historical average (see chart below). Nationwide, sales were up 1.9% month-over-month, and relative to a year ago, sales rose 6.7% marking the biggest year-over-year gain since the booming summer of 2016.
Sales were up in only half of all local markets, but that list included almost all large markets, led by gains in both the Greater Vancouver (GVA) and Greater Toronto (GTA) areas. There were encouraging bursts of activity in Victoria, Calgary and, to a lesser degree, Edmonton. Resale activity was up 24% from April in Vancouver, Victoria posted a 10% gain, and Calgary resales rose 6.6% month-over-month.
These are early signs that the cyclical bottom has been reached in that region of the country. Market conditions are still soft, though. Property values remain under downward pressure for now with the MLS Home Price Index down from a year ago in May in Vancouver (-8.9%), Calgary (-4.3%) and Edmonton (-3.7%). That said, the rate of decline moderated in Calgary and Edmonton, which is a further sign that these markets are stabilizing.
New Listings
The number of newly listed homes edged downward by 1.2% in May. With sales up and new listings down, the national sales-to-new listings ratio tightened to 57.4% in May compared to 55.7% in April. Based on a comparison of the sales-to-new listings ratio with the long-term average, almost three-quarters of all local markets were in balanced market territory in May 2019.
There were 5.1 months of inventory on a national basis at the end of May 2019, down from 5.3 in April and 5.6 months back in February. Like the sales-to-new listings ratio, the number of months of inventory is within close reach its long-term average of 5.3 months.
Housing market balance varies significantly by region. The number of months of inventory has swollen far beyond long-term averages in Prairie provinces and Newfoundland & Labrador, giving homebuyers in those parts of the country ample choice. By contrast, the measure remains well below long-term averages for Ontario and Maritime provinces, resulting in increased competition among buyers for listings and fertile ground for price gains.
Home Prices
MLS® HPI data are now available on a seasonally adjusted basis in addition to the actual (not seasonally adjusted) figures. On a seasonally adjusted basis, the Aggregate Composite MLS® HPI edged down 0.2% in May 2019 compared to April and stood 1.4% below the peak reached in December 2018.
Seasonally adjusted MLS® HPI readings in May were up from the previous month in 12 of the 18 markets tracked by the index; however, home price declines in the Lower Mainland of British Columbia contributed to the monthly decline in the overall index. Markets where prices rose in May from the month before include Victoria (0.5%), Edmonton (0.2%), Saskatoon (0.4%), Ottawa (0.7%), Niagara (0.2%), Oakville (0.8%), Guelph (0.5%), Barrie (3.6%), Montreal (0.5%) and Greater Moncton (0.5%), with gains of 0.1% in the GTA and Regina. By contrast, readings were down from the month before in the GVA (-1.0%), Fraser Valley (-1.1%), the Okanagan Valley (-1.3%), Calgary (-0.1%) and Hamilton (-0.7%), while holding steady on Vancouver Island outside Victoria.
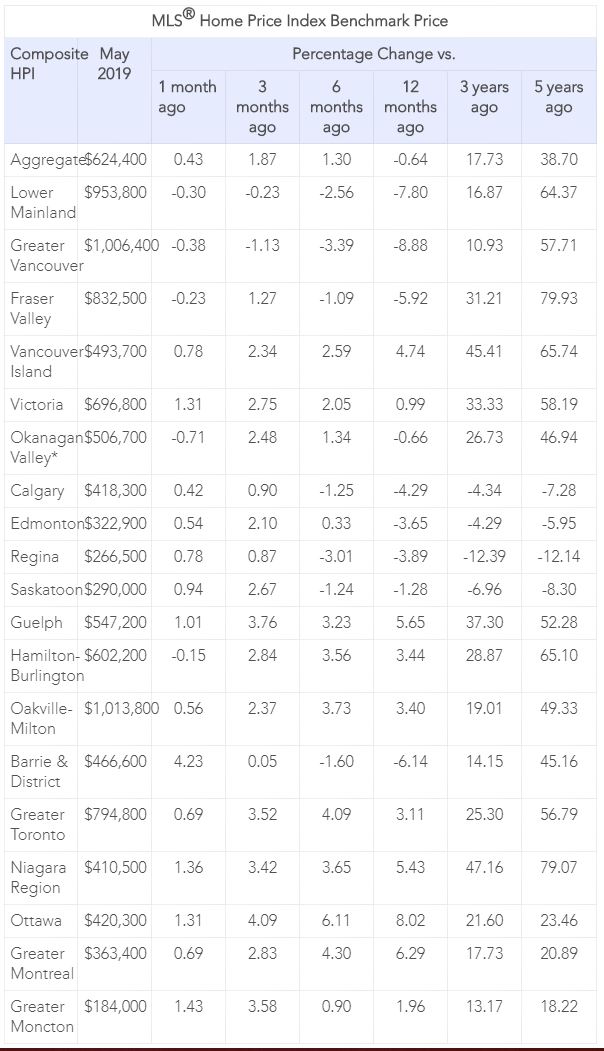
Trends continue to vary widely among the 18 housing markets tracked by the MLS® HPI. Results remain mixed in British Columbia, with prices down on a y/y basis in the GVA (-8.9%), the Fraser Valley (-5.9%) and the Okanagan Valley (-0.7%). Meanwhile, prices edged up 1% in Victoria and climbed 4.7% elsewhere on Vancouver Island.
Among Greater Golden Horseshoe housing markets tracked by the index, MLS® HPI benchmark home prices were up from year-ago levels in Guelph (+5.7%), the Niagara Region (+5.4%), Hamilton-Burlington (+3.4%), Oakville-Milton (+3.4%) and the GTA (+3.1%). By contrast, home prices in Barrie and District held below year-ago levels (-6.1%).
Across the Prairies, supply remains historically elevated relative to sales and home prices remain below year-ago levels. Benchmark prices were down by 4.3% in Calgary, 3.6% in Edmonton, 3.9% in Regina and 1.3% in Saskatoon. The home pricing environment will likely remain weak in these cities until demand and supply return to better balance.
Home prices rose 8% y/y in Ottawa (led by a 12.2% increase in townhouse/row unit prices), 6.3% in Greater Montreal (led by a 7.6% increase in condo apartment unit prices), and 2% in Greater Moncton (led by a 15.9% increase in apartment unit prices). (see Table 1 below)
Bottom Line: The Bank of Canada is counting on a rebound in economic activity in the current quarter and believes growth will accelerate further in Q4 and 2020. That should keep the Bank on the sidelines for some time. Currently, the markets are expecting the Federal Reserve to cut interest rates in July and to continue to do so in 2020. Indeed, President Trump is lobbying hard for rate cuts. It is unlikely that the Bank of Canada will follow the Fed unless the trade war with China worsens. Political pressure is mounting on the administration to reduce trade tensions. Trade uncertainty is the only thing right now that would derail the Canadian recovery.
 “We are thrilled with the opportunity before us with RFA as our capital partner,” Street Capital Bank CEO Duncan Hannay told CMT. “This brings new strength to the broker channel…We’ll combine the benefit of a bank balance sheet to support non-prime lending with a scale originator in prime.”


 Siddall also participated in a panel discussion hosted by the Global Risk Institute this week where he was challenged on the formula behind the stress test by CIBC World Markets Deputy Chief Economist Benjamin Tal, who argued the formula should be more flexible to allow for adjustment when rates rise and fall.
 Meanwhile, the Office of the Superintendent of Financial Institutions (OSFI), which was responsible for introducing the mortgage stress test, said this week that the new rules are “working.”


