General

Download My Mortgage Toolbox!

Home Prices Post Monthly Gain as Supply Tightens

General Beata Gratton 16 Sep

Home Prices Post Monthly Gain as Supply Tightens

National home prices posted their first monthly increase since February as housing inventory tightened further to “extremely low” levels, the Canadian Real Estate Association reported.

The average selling price in August was $663,500, up 13.3% year-over-year and a 0.5% increase from July, ending a four-month streak of monthly price declines.

Since the March peak, average prices have fallen 7.4%. Removing the high-priced markets of the Greater Toronto and Vancouver areas, the average price stands at $533,500.

There were 50,876 home sales in August, down 14% from a year earlier, but still the second-best August result in history, CREA noted.

“Canadian housing markets appear to be stabilizing somewhere in between pre- and peak-pandemic levels—which is to say, still extremely unbalanced,” said Shaun Cathcart, CREA’s Senior Economist.

Housing Inventory Remains “Extremely Low”

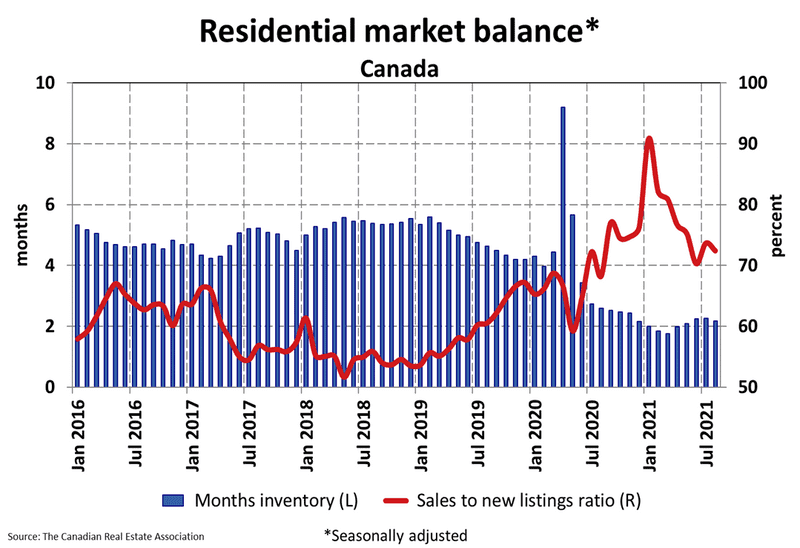
Already near a historical low, housing inventory ticked down to 2.2 months in August. Housing inventory is the amount of time it would take to liquidate current inventories at today’s rate of sales.

“This is extremely low–still indicative of a strong seller’s market at the national level and in most local markets,” CREA noted. “The long-term average for this measure is more than twice where it stands today.”

For housing analyst Ben Rabidoux, President of North Cove Advisors, the dramatic fall in supply is the big story in Canadian housing market.

“We’ve gotten inventory levels that are down 60% nationally from 2015 levels,” he said during a recent webinar hosted by Mortgage Professionals Canada. “Just an absurd relentless decline, and that is the story of Canadian housing right now.”

Rabidoux noted that inventory levels would need to more than double or home sales would have to fall in half—or some combination of both—before we see prices start to fall.

“We are so far from a balanced housing market that we can double supply and still be in a seller’s market,” he said. “So, we have a chronic shortage of supply.”
Residential market balance_CREA

Cross-Country Roundup of Home Prices

Here’s a look at some more regional and local housing market results for August:

  • Ontario: $834,932 (+15.1%)
  • Quebec: $451,904 (+14.7%)
  • B.C.: $899,173 (+16.8%)
  • Alberta: $417,321 (+4.2%)
  • Barrie & District: $739,200 (+35%)
  • Greater Montreal Area: $497,800 (+21.7%)
  • Victoria: $854,300 (+19.8%)
  • Halifax-Dartmouth: $442,284 (+19%)
  • Ottawa: $653,200 (+18.5%)
  • Greater Toronto Area: $1,059,200 (+17.4%)
  • Greater Vancouver Area: $1,176,600 (+13.2%)
  • Winnipeg: $318,900 (+11.6%)
  • Calgary: $446,500 (+10%)
  • St. John’s: $286,200 (+7.6%)
  • Edmonton: $343,100 (+5.8%)

CREA Lowers its Home Sales Forecast, Raises Price Expectations

Due to the tight supply conditions and rising home prices, the Canadian Real Estate Association unveiled an updated forecast for the year.

It now expects 656,300 homes to exchange hands in 2021, a jump of roughly 19% from 2020, but down slightly from its previous forecast of 682,900.

Looking ahead to 2022, home sales are expected to fall 12.1% to 577,000 units.

“Limited supply and higher prices are expected to tap the brakes on activity in 2022 compared to 2021, although increased churn in resale markets resulting from the COVID-related shake-up to so many people’s lives may continue to boost activity above what was normal before COVID-19,” CREA noted.

The association also bumped up its home price forecast for 2021 to $680,000, a 19.9% increase from 2020. It had previously forecast an average selling price of $678,000 for 2021.

Prices are expected to continue to rise in 2022 to an average of $718,000, up 5.6% on an annual basis.

Steve Huebl

Annual Inflation In August Rises to 4.1% in Canada–But Are We Close To The Peak?

General Beata Gratton 16 Sep

Annual Inflation In August Rises to 4.1% in Canada–But Are We Close To The Peak?


Today’s release of the August Consumer Price Index (CPI) for Canada posted another uptick in the year-over-year (y/y) inflation rate, but hidden in the details was some support for the Bank of Canada’s position that the spike in inflation is transitory. The Bank has long suggested that the rise in prices will prove to be the result of base effects (y/y comparisons that are biased upward by the temporary decline in prices one year ago), supply disruptions, and the surge in pent-up demand accompanying the reopening of the global economy.

This morning’s Stats Canada release showed that consumer price inflation surged to a 4.1% y/y pace last month, above the 3.7% pace recorded in June, and the 3.1% pace in May. This is now the fifth consecutive month in which inflation is above the 1%-to-3% target band of the Bank of Canada.

The good news, however, is that the monthly rise in prices slowed on a (seasonally adjusted basis) in August to 0.4% compared to the 0.6% rise in July. As well, core measures of inflation preferred by the Bank of Canada, which exclude food and energy, are considerably lower than the all-items measures of the CPI. All three of the BoC’s core inflation measures rose on a y/y basis last month to an average level of 2.6% vs. the all-items level of 4.1%.


The major contributors to the surge in inflation didn’t change in August. Gasoline prices rose a whopping 32.5% y/y, owing to production cuts and disruptions in the wake of Hurricane Ida. This more than offset the decline in demand due to the rise in the Delta variant, causing a sharp slowdown in China and other hard-hit regions. The homeowners’ replacement cost index, related to the price of new and existing homes, rose to 14.3% in August–the largest annual increase since September 1987. Similarly, the other owned accommodation expenses index, which includes commission fees on the sale of real estate, rose 14.3% year over year in August. The easing of travel restrictions boosted demand for airfares and hotel accommodation when labour shortages and rising energy costs pressed these industries. Meat prices have also surged in the past year as restaurant demand spiked. Auto sector prices continued to rise sharply as the inventories of new vehicles, disrupted by the chip shortage, hit new record lows.

Bottom Line

As the first chart below shows, the US has posted the highest level of inflation in the G-7, as the economic rebound there has outpaced that of its counterparts where Covid restrictions were more pervasive. Yet, yesterday’s release of the US August CPI report showed a marked slowdown in inflation pressure, leading some to suggest that the transitory view of inflation has been validated.

One thing to watch, however, is wage rates. Job vacancies and labour shortages have pushed up wages in some sectors, especially in the hardest-hit low-wage hospitality and leisure sectors, including food services and accommodation. If price pressures become validated by enough wage inflation, we run the risk of inflation becoming embedded. Wage-price spiraling has not been a factor since the 1970s when labour unions were much stronger and labour had much more pricing power.

Financial markets appear to be sanguine about the prospect for inflation-induced rate hikes in the near term. Bond yields remain historically low. Next week, we will hear more from the Fed on this subject as the policy-making group releases its report on Wednesday, September 22.

Dr. Sherry Cooper

Home Prices Still Rising As Falling Sales Reflect Insufficient Supply

General Beata Gratton 15 Sep

Home Prices Still Rising As Falling Sales Reflect Insufficient Supply


Today the Canadian Real Estate Association (CREA) released statistics showing national existing home sales fell a slight 0.5% nationally from July to August 2021–the fifth consecutive monthly decline. Over the same period, the number of newly listed properties edged up 0.8%, and the MLS Home Price Index rose 0.9% m/m bringing the year-over-year (y/y) rise to 21.3%. Transactions appear to be stabilizing at a more sustainable, but still strong level (see chart below).

Small declines in the GTA and Montreal were offset by gains in the Fraser Valley, Quebec City and Edmonton.

The actual (not seasonally adjusted) number of transactions in August 2021 was down 14% on a year-over-year basis from the record set for that month last August. That said, it was still the second-best month of August in history.


New Listings

The number of newly listed homes ticked 1.2% higher in August compared to July. As with sales activity, it was a fairly even split between markets that saw declines and gains. New supply declines in the GTA and Ottawa were offset by gains in Vancouver and Montreal among bigger Canadian markets.

With both sales and new listings relatively unchanged in August, the sales-to-new listings ratio remained a tight 72.4% compared to 73.6% in July. The long-term average for the national sales-to-new listings ratio is 54.7%.

Based on a comparison of sales-to-new listings ratio with long-term averages, a small majority of local markets remain in seller’s market territory. The remainder are in balanced territory.

There were 2.2 months of inventory on a national basis at the end of August 2021, down a bit from 2.3 months in July. This is extremely low – still indicative of a strong seller’s market at the national level and most local markets. The long-term average for this measure is more than twice where it stands today. It was also the first time since March that this measure of market balance tightened up.


Home Prices

The Aggregate Composite MLS® Home Price Index (MLS® HPI) rose 0.9% month-over-month in August 2021. In line with tighter market conditions, this was the first acceleration in month-over-month price growth since February. While the trend of re-accelerating prices was first observed earlier this summer in Ontario, the reversal at the national level in August was less of a regional story and more of a critical mass story. Synchronous trends across the country have been the defining feature of the housing story since COVID-19 first hit, and that still appears to be the case.

The non-seasonally adjusted Aggregate Composite MLS® HPI was up 21.3% on a year-over-year basis in August.

Looking across the country, year-over-year price growth is averaging around 20% in B.C., though it is lower in Vancouver, a bit lower in Victoria, and higher in other parts of the province. Year-over-year price gains are in the mid-to-high single digits in Alberta and Saskatchewan, while gains were a little over 10% in Manitoba.

Ontario saw year-over-year price growth still over 20% in August. However, as with B.C. big, medium and smaller city trends, gains are notably lower in the GTA, around the provincial average in Oakville-Milton, Hamilton-Burlington and Ottawa, and considerably higher in most smaller markets in the province.

The opposite is true in Quebec, where Greater Montreal’s year-over-year price growth, at a little over 20%, is almost double that of Quebec City. Price growth is running a little above 30% in New Brunswick (higher in Greater Moncton, a little lower in Fredericton and Saint John), while Newfoundland and Labrador is in the 10% range on a year-over-year basis (a bit lower in St. John’s).


Bottom Line

Local housing markets are cooling off as prospective buyers contend with a dearth of homes for sale. Though increasing vaccination rates have begun to bring a return to normal life in Canada, that’s left the country to contend with one of the developed world’s most severe housing shortages and little prospect of much new supply becoming available soon despite all of the election promises. As net new immigration resumes, this excess demand in housing will mount. The impediments to a rapid rise in housing supply, both for rent and purchase, are primarily in the planning and approvals process at the municipal levels. Federal election promises do not address these issues.

Dr. Sherry Cooper

August Employment Report Showed Continuing Recovery

General Beata Gratton 13 Sep

August Employment Report Showed Continuing Recovery


This morning, Statistics Canada provided us with some much-needed good news on the economic front following last week’s surprisingly dismal Q2 GDP report. Canada’s labour market continued its recovery in August, especially in the hardest-hit food services and accommodation sectors. The August Labour Force Survey (LFS) data reflect conditions during the week of August 15 to 21. By then, most regions of Canada had lifted many of the Covid-related restrictions. However, there were capacity restrictions in such indoor locations as restaurants, gyms, retail stores and entertainment venues. Also, for the first time since March 2020, border restrictions were lifted for fully vaccinated non-essential travellers from the US.

However, the reopening of the Canadian economy has been creaky, owing to supply constraints and difficulty in filling job vacancies in sectors that require high-contact interfaces, especially with the concern regarding a fourth wave of the delta variant. Nevertheless, today’s LFS indicated that employment grew last month by 90,200, the third consecutive monthly gain, further closing the pandemic gap. Employment is now within 156,000 (-0.8%) of its February level, the closest since the onset of the pandemic. Moreover, most of the net new jobs were in full-time work. Increases were mainly in the service sector, led by accommodation and food services.


The jobless rate fell from 7.5% in July to 7.1% in August. The unemployment rate peaked at 13.7% in May 2020 and has trended downward since, despite some short-term increases during the fall of 2020 and spring of 2021. In the months leading up to the pandemic, the unemployment rate had hovered around historic lows and was 5.7% in February 2020.

The adjusted unemployment rate—which includes discouraged workers–those who wanted a job but did not look for one—was 9.1% in August, down 0.4 percentage points from one month earlier.

Employment increased in Ontario, Alberta, Saskatchewan and Nova Scotia in August. All other provinces recorded little or no change. For the third consecutive month, British Columbia was the lone province with employment above its pre-pandemic level. Compared with February 2020, the employment gap was largest in Prince Edward Island (-3.4%) and New Brunswick (-2.7%). The table below shows the jobless rates by province.


Bottom Line 

The Bank of Canada this week once again suggested that it would not begin to tighten monetary policy until the economy returned to full capacity utilization, which they estimate will not be until at least the second half of next year. Employment will need to surpass pre-pandemic levels before complete recovery is declared because the population had grown since the start of the crisis 18 months ago.

Although August was another solid month for the jobs market, there is a wide disparity across sectors of the job market in the degree to which they have recovered from the effects of the pandemic. The table below shows the employment change in percentage terms by sector compared with February 2020.

Sectors where remote work has been widespread–such as professional, scientific and technical services, public administration, finance, insurance and real estate–have seen a net gain in employment. However, in high-touch sectors that were deemed nonessential, the jobs recovery has been far more constrained. This is especially true in agriculture, accommodation and food services, and recreation.


Dr. Sherry Cooper

Bank of Canada Responds To Weak Q2 Economy–Holding Policy Steady

General Beata Gratton 9 Sep

Bank of Canada Responds To Weak Q2 Economy–Holding Policy Steady


As we await the quarterly economic forecast in next month’s Monetary Policy Report, the Bank of Canada acknowledged that the Q2 GDP report, released last week, caught them off-guard. In today’s policy statement, the Governing Council of the Bank said, “In Canada, GDP contracted by about 1 percent in the second quarter, weaker than anticipated in the Bank’s July Monetary Policy Report (MPR). This largely reflects a contraction in exports, due in part to supply chain disruptions, especially in the auto sector. Housing market activity pulled back from recent high levels, largely as expected. Consumption, business investment and government spending all contributed positively to growth, with domestic demand growing at more than 3 percent. Employment rebounded through June and July, with hard-to-distance sectors hiring as public health restrictions eased. This is reducing unevenness in the labour market, although considerable slack remains and some groups – particularly low-wage workers – are still disproportionately affected. The Bank continues to expect the economy to strengthen in the second half of 2021, although the fourth wave of COVID-19 infections and ongoing supply bottlenecks could weigh on the recovery” (see chart below).


Bank Says CPI Inflation Boosted By Temporary Factors–Maybe

Financial conditions remain highly accommodative around the globe. And the Bank today continued to assert that the rise in inflation above 3% is expected, “boosted by base-year effects, gasoline prices, and pandemic-related supply bottlenecks. These factors pushing up inflation are expected to be transitory, but their persistence and magnitude are uncertain and will be monitored closely. Wage increases have been moderate to date, and medium-term inflation expectations remain well-anchored. Core measures of inflation have risen but by less than the CPI.”

The Governing Council again stated the Canadian economy still has considerable excess capacity, and the recovery continues to require extraordinary monetary policy support. “We remain committed to holding the policy interest rate at the effective lower bound until economic slack is absorbed so that the 2 percent inflation target is sustainably achieved.” Concerning forward guidance, the Bank said, “We remain committed to holding the policy interest rate at the effective lower bound until economic slack is absorbed so that the 2 percent inflation target is sustainably achieved. In the Bank’s July projection, this happens in the second half of 2022.” This seems to be a placeholder statement, allowing the Bank to reassess the outlook next month, possibly delaying the guidance if the economy continues to perform below their July projection.

Similarly, the Bank maintains its Quantitative Easing program at the current pace of purchasing $2 billion per week of Government of Canada (GoC) bonds, keeping interest rates low across the yield curve. “Decisions regarding future adjustments to the pace of net bond purchases will be guided by Governing Council’s ongoing assessment of the strength and durability of the recovery. We will continue to provide the appropriate degree of monetary policy stimulus to support the recovery and achieve the inflation objective”.

Bottom Line

Only time will tell if the Bank of Canada is correct in believing that inflation pressures are temporary. Financial markets will remain sensitive to incoming data, but bond markets seem willing to accept their view for now. The 5-year GoC bond yield has edged down from its recent peak of 1.0% posted on June 28th to a current level of .80%. In contrast, the Canadian dollar had weakened significantly since late June when it was over US$0.825 to US$0.787 this morning. Clearly, the Bank of Canada is committed to keeping Canadian interest rates low for the foreseeable future.

The next Bank of Canada policy decision date is October 27th. Stay tuned for the Canadian employment report this Friday.

Dr. Sherry Cooper

Royal Bank Added $9 Billion in Mortgages to its Portfolio this Quarter

General Beata Gratton 27 Aug

Royal Bank Added $9 Billion in Mortgages to its Portfolio this Quarter

Royal Bank exceeded expectations for its third-quarter earnings, driven in large part by strong mortgage growth.

Canada’s largest bank grew its mortgage portfolio by $37 billion over the past year, with a gain of $9 billion in the last quarter alone. President and CEO David McKay said he expects “strong mortgage growth to continue.”

National Bank of Canada also saw strong results, thanks to a strong housing market in Quebec. Its residential mortgage portfolio was up 12% year-over-year.

Both banks also continued to release more funds from provisions they had set aside for potential credit losses at the start of the pandemic, much like BMO and Scotiabank, which released their earnings yesterday.

We’ve picked through both banks’ quarterly earnings reports, presentations and conference calls, and compiled all the mortgage notables below.

TD Bank and CIBC will round out the Big 6 banks’ Q3 earnings on Thursday.


Royal Bank of CanadaRBC

Q3 net income: $4.3 billion (+34% Y/Y)
Earnings per share: $3

  • RBC’s residential mortgage portfolio rose this quarter to $320 billion, up from $283.4 billion a year ago.
  • The bank’s HELOC portfolio fell to $35 billion from $37 billion a year ago.
  • 71% of its mortgages are uninsured, up from 66% a year ago. The average LTV on the uninsured portion is 47%, down from 51% a year ago.
  • 90+ day delinquencies in the residential mortgage portfolio fell to 0.14% from 0.16% in Q2 and 0.17% a year ago.
  • RBC recovered $540 million of provisions for credit losses.
  • 53% of the bank’s uninsured mortgage portfolio has an average FICO score of at least 800.
  • Condos make up 11% of balances in the bank’s outstanding residential lending portfolio.
  • Net interest margin was 2.51%, down from 2.55% in Q2 and 2.58% in Q3 2020, “largely due to competitive pricing, pressures in mortgages, and changes in asset mix,” said President and CEO David McKay.

Source: RBC Q3 Investor Presentation

Conference Call

  • “In Canadian Banking, we added a market-leading $37 billion in mortgages year-over-year, including over $9 billion this quarter,” said McKay. “And we expect strong mortgage growth to continue, albeit at a lower rate than we’ve seen over an exceptional last 12 months.”
  • Over the past year, RBC has added 1,700 employees to “capture strong client activity in mortgages, commercial banking and investment,” he added. One-third of RBC’s mortgage volume is coming from new bank clients.
  • Asked for comment on the strong mortgage growth the bank has seen in the quarter, McKay said the market continues to deal with supply-demand imbalances, caused by everything from low interest rates and consumer preference changes to a lack of supply and price increases. Even RBC has been impacted by the rising cost of housing, McKay noted. “As an employer in the major metropolitan areas, we certainly worry about the cost of housing and the effects on our employees, and our ability to attract talent to the country and to the cities where we operate,” he said. “One of the reasons why we created the Calgary hub for technology is to diversify our employee base across the country and access talent in different marketplaces.”
    • Having said that, McKay said he’s not worried about the quality of the bank’s credit book, noting that one-third is insured. “We’re confident in the cash flows and the stress test, and the policies that have gone into changing those stress tests to make sure adjudication is solid. So, this is more a long-term macroeconomic issue,” he said. “Where I do worry..is the more cash flow that consumers are putting into housing stock, the less is available to drive the economy. So I think all policy-makers are worried, partly as well about long-term economic drag from that much cash flow going into servicing housing.”
  • “Looking forward, we expect a 25-basis-points increase in the short-term interest rates, with the long-end of the curve unchanged, [which] would increase Canadian Banking net interest income by $90 million,” McKay said.
  • McKay noted that provisions for credit losses (PCL) is at its lowest level in more than five years, adding that the bank realized $16 million in PCL reversals.

Source: RBC Conference Call

National Bank of Canada

Q3 net income: $839 million (+39% Y/Y)
Earnings per share: $2.36 a share

  • The bank’s residential mortgage portfolio rose to $56.2 billion in Q3, up from $50.1 billion a year ago.
  • The bank’s residential mortgage portfolio is 34% insured, down from 38% a year ago.
  • NBC’s HELOC portfolio rose to $25.9 billion, up from $23.6 billion a year ago.
  • The average LTV on the uninsured mortgage portfolio was 55% (down from 59%), while the average LTV on the HELOC portfolio was 50% (down from 56%).
  • Quebec represented 54% of the mortgage book (up from 55% from a year ago), while Ontario made up 27% (up from 26%) and Alberta 7% (down from 8%).
  • Net interest margin was 2.11% in Q3, down from 2.15% a year earlier.
  • Of the bank’s uninsured residential mortgage portfolio, 0.11% are in arrears by 90+ days, down from 0.34% in Q3 2020.
  • Provisions for credit losses on impaired loans fell to $34 million, down from $88 million a year ago.
  • This earnings release was the least for President and CEO Louis Vachon, who is retiring from his position at the end of October after 29 years with the bank, nearly 15 years as CEO. Chief operating officer Laurent Ferreira will take over the top post starting Nov. 1.

Source: National Bank Q3 Investor Presentation

Conference Call

  • “Our credit quality is strong and our portfolios have performed well since the beginning of the pandemic,” said Vachone. “Given the continued improvement in economic and market indicators, we have released $43 million in reserves this quarter.”
  • “We believe that the forces driving the estate market will continue to be present,” said Lucie Blanchet, Executive VP, Personal Banking and Client Experience. “We think demand would continue to be stimulated by the lower interest rate environment, as well as the changing housing needs as a consequence of the flexible working conditions that the employers are now offering. And eventually, the reopening of immigration will also be a factor medium-term.”
  • “I think one of the factors is also the short supply that will continue to put pressure on the markets,” Blanchet added. “We see that we are continuing to be well-positioned to capture that market share.”
  • Given NBC’s strong mortgage growth in the quarter, Blanchet was asked how much of that volume could be attributed to mortgage brokers, since the bank has re-entered the broker channel exclusively through M3 Group brokers. “75% of our growth comes from our proprietary channel, which is really at the core of our strategy,” she said. “…our intent is to keep our strategy focused on our proprietary channel going forward.”

Source: NBC Conference Call

BMO and Scotiabank Q3 Earnings: Lower Provisions Lead to a Near-Doubling in Profits

General Beata Gratton 25 Aug

BMO and Scotiabank Q3 Earnings: Lower Provisions Lead to a Near-Doubling in Profits

Bank of Montreal and Scotiabank kicked off third-quarter earnings for the Big 6 banks this week, with both reporting a sharp rise in profits.

That was largely due to both banks reducing their loan loss provisions, or money set aside to cover loan losses. At the start of the pandemic, the big banks collectively put aside more than $5 billion in provisions, but have since been scaling that figure back as the economic situation improved and large-scale loan losses never materialized.

Scotiabank’s loan loss provisions this quarter dropped to $380 million from $2.2 billion a year ago. Meanwhile, BMO said it booked just $60 million in total provisions this quarter, down from $1.12 billion in Q3 2020. It also managed to reverse provisions that had already been booked to the tune of $70 million.

We’ve picked through the banks’ quarterly earnings reports, presentations and conference calls, and compiled all the mortgage notables below.

We’ll receive earnings from RBC and National Bank of Canada on Wednesday, with TD and CIBC to follow on Thursday.


Bank of MontrealBMO

Q3 net income: $2.28 billion (+85% Y/Y)
Earnings per share: $3.44

  • BMO’s residential mortgage portfolio rose to $126.3 billion, up from $115.6 billion a year earlier.
  • The HELOC portfolio—69% of which is amortizing—rose to $40.3 billion from $35 billion a year ago.
  • 34% of BMO’s residential mortgage portfolio is insured, down from 40% a year ago.
  • The loan-to-value on the uninsured portfolio is 48%, down from 54% a year ago.
  • 79% of the portfolio has an effective remaining amortization of 25 years or less, down from 80% a year ago.
  • Net interest margin (NIM) in the quarter was 2.62%, up from 2.54% in Q3 2020.
  • Provisions for Credit Losses (PCL) was $380 million in Q3, down from $2.2 billion in Q3 2020.
  • The 90-day delinquency rate fell to 14 bps from 22 bps a year ago, with the loss rate for the trailing four-quarter period at 1 bp (unchanged).

Source: BMO Q3 Investor Presentation

Conference Call

  • “The impact of a 25-basis-point increase in short-term rates would add over $100 million to revenue over the next 12 months,” said Tayfun Tuzun, Chief Financial Officer.
  • “Given the relatively strong consensus economic outlook and our specific forecast for impaired losses in the year ahead, we remain comfortable that our $2.7 billion of performing loan allowances provides more than adequate provisioning against loan losses in the coming year,” said Pat Cronin, Chief Risk Officer.
  • “In terms of the outlook, we remain cautiously optimistic given the solid credit performance we’ve seen in the last four quarters,” Cronin added. “While uncertainty remains in terms of the future path of the pandemic and variants of concern, assuming economic strength continues in line with consensus estimates, we would expect further releases from our performing provision in the coming quarters.”

Source: BMO Conference Call


ScotiabankScotiabank

Q3 net income: $2.54 billion (+95% Y/Y)
Earnings per share: $1.99

  • The total portfolio of residential retail mortgages rose to $243 billion in Q3, up 10% from $220 billion in Q3 2021.
  • Net interest margin fell to 2.23%, down from 2.26% in Q3 2021 “from strong growth in mortgages and commercial loans.”
  • Mortgage loans that were 90+ days past due fell to 0.13% from 0.19% a year ago.
  • Scotia’s provisions for credit losses declined 18 basis points from Q2 to 100 bps.

Source: Scotiabank Q3 Investor Presentation

Conference Call

  • “What we saw through the quarter was consumer lending was strong in every single one of our product lines,” said Dan Rees, Group Head, Canadian Banking. “We see the mortgage book continuing to grow from here…And I think it will be an interesting year next year when we look at the role that home improvements will play given that the mortgage market will continue to roll on the secured line portfolio.”

Source: Scotiabank Conference Call

What Does High Inflation Mean for Mortgage Rates?

General Beata Gratton 24 Aug

What Does High Inflation Mean for Mortgage Rates?

Canada’s inflation rate came in above expectations last week, rising to its highest level in more than a decade.

If above-target inflation persists, it could have ramifications for homeowners in the form of shifting rate-hike expectations.

Canada’s inflation rate came in burning hot at 3.7% for July, according to data released by Statistics Canada. That’s the third consecutive monthly inflation reading that has come in above the Bank of Canada’s neutral range of 1.75% to 2.75%, which is the range needed to support the economy at full employment/maximum output while keeping inflation under control.

But the Bank of Canada continues to believe that elevated consumer prices will prove temporary and are largely the result of an economy recovering from the pandemic-induced slump.

“…inflation is likely to remain above 3% through the second half of this year and ease back toward 2% in 2022, as short-run imbalances diminish and the considerable overall slack in the economy pulls inflation lower,” the Bank said following last month’s interest rate decision. “The factors pushing up inflation are transitory, but their persistence and magnitude are uncertain and will be monitored closely.”

More recently, Bank of Canada Governor Tiff Macklem reaffirmed the messaging that everything is under control in a July 29 Financial Post column. “The Bank of Canada remains firmly committed to keeping inflation low, stable and predictable,” he wrote. “Even with the gyrations caused by the pandemic, inflation has averaged pretty close to target through the past few years to today. You can be confident that we will keep the cost of living under control as the economy reopens.”

But the central bank can only allow high inflation to persist for so long before a policy response is required.

“The Bank of Canada may be willing to tolerate higher inflation while the economy is still re-opening and recovering from the health shock, but it will respond to more lasting price pressures by reducing monetary accommodation,” wrote TD Bank senior economist James Marple in a recent post. “In the near-term, asset purchases are likely to continue to be pared back, with rate hikes likely to follow late next year.”

At the Bank’s last rate decision meeting in July, it announced that it was reducing its bond-buying program to $2 billion per week from $3 billion.

At the height of the pandemic, the BoC embarked on a quantitative easing program in which it purchased at least $5 billion worth of bonds each week to flood the market with liquidity, in turn keeping 5-year bond yields—and by extension, 5-year fixed mortgage rates—lower than they otherwise would be.

Average mortgage rates remain slightly above their all-time lows reached in December. But the question is, for how much longer?

The Timing of Future Rate Hikes

Those concerned about imminent rate hikes can take solace in the Bank of Canada’s repeated forecast that rates won’t increase until the second half of next year.

We remain committed to holding the policy interest rate at the effective lower bound until economic slack is absorbed so that the 2% inflation target is sustainably achieved. In the Bank’s July projection, this happens sometime in the second half of 2022,” read the BoC’s statement from its July rate meeting.

The bond market’s read on future rate hikes is that consumers can expect one quarter-point rate hike over the next year, which would take the BoC’s overnight lending rate from its current record low of 0.25% to 0.50%.

And despite the latest high inflation figures, the bond market is actually forecasting one less rate hike over the next two years compared to a couple of months ago—it now expects three 25-bps hikes over the next two years, down from four. Looking three years out, the Bank of Canada is expected to deliver five quarter-point rate hikes in total, bringing the overnight rate to 1.50%.

This would cause prime rate to increase, leading to higher monthly payments for many borrowers with variable-rate mortgages. For those with fixed-payment variable mortgages, the amount of their payment going towards paying down the principal will decline, and the amount going towards interest will increase.

If prime rate was to rise 125 basis points over the next three years, the average mortgage payment could increase by approximately $180 a month, or $2,172 a year, based on today’s average mortgage amount and the lowest variable rates available nationally.

Borrowers with fixed-rate mortgages would not be immediately impacted by rising rates until their mortgage comes up for renewal at the end of their term, or unless they choose to refinance.

“While we are not overly concerned of a payment shock for renewals, the increase in mortgage rates will certainly impact purchasing power for many,” economists from National Bank of Canada wrote in a recent note.

Steve Huebl

Mortgage Borrowing Grew at its Fastest Monthly Pace Ever in June

General Beata Gratton 20 Aug

Mortgage Borrowing Grew at its Fastest Monthly Pace Ever in June

Mortgage debt in Canada soared above $1.7 trillion in June, growing at a monthly pace never before seen, according to Statistics Canada.

The new figures show mortgage debt grew 9.2% compared to the same time last year, a pace not seen since 2008, and jumped 1.37% since May, which StatCan noted is the largest monthly increase on record.

In the first half of 2021, households have added $81.6 billion in mortgage debt, compared with $108.6 billion over all 12 months of 2020.

Historically low interest rates have spurred demand for housing over the past year, despite record gains in home prices. StatCan added that the Office of the Superintendent of Financial Institutions’ (OSFI) stricter stress test qualification rules for uninsured mortgages came into effect on June 1, “which may have spurred additional borrowing prior to the deadline.”

“While the rise in mortgage debt accelerated, the volume of housing resale activity and the average resale price have been on a downward trend after reaching peaks in March of 2021,” the agency said, noting that there is typically a lag time between the sale of a home and the actual receipt of mortgage funds.

“However, borrowers may also be in the market for a new home, or otherwise be taking additional equity out of their home or consolidating debt when refinancing their existing mortgages,” it added.

Non-mortgage debt also grew in June, led by a 2.7% rise in personal loans and a 1.6% rise in credit card borrowing.

“Credit card debt increased for the fourth month in a row as pandemic-related restrictions eased,” Statistics Canada noted. “Lines of credit also rose by $1.7 billion, but this was fuelled by growth in home equity lines of credit.”

Mortgage borrowing from private non-financial corporations also ticked up in the month, rising 0.9%, or $2.9 billion, to $346.6 billion.

Annual Inflation Hits 3.7% in Canada–A New Election Issue

General Beata Gratton 18 Aug

Annual Inflation Hits 3.7% in Canada–A New Election Issue

This morning’s Stats Canada release showed that the July CPI surged to a 3.7% year-over-year pace, well above the 3.1% pace recorded in June. This is now the fourth consecutive month in which inflation is above the1% to 3% target band of the Bank of Canada. And given the flash election, opposition parties are already making hay. “The numbers released today make it clear that under Justin Trudeau, Canadians are experiencing a cost of living crisis,” Conservative Leader Erin O’Toole said in a statement. He went on to suggest that the Liberal government is stoking inflation with its debt-financed government spending programs.

While it is true that deficit spending has surged during the pandemic, the same is also true for nearly every country in the world. Moreover, accelerating inflation is a global phenomenon and most central banks believe it to be temporary. Certainly, Tiff Macklem is firmly of that view, as is the Fed Chair Jerome Powell.

Supply disruptions and base effects have largely caused the rise in inflation. Semiconductor production, for example, slumped during the 2020 lockdowns, and then couldn’t be ramped up fast enough when demand for cars and electronics returned, leading the prices of new and used autos to rise at a record pace. Prices for airfares and hotel stays also jumped. Companies found themselves short of workers as they reopened, leading some to offer bonuses or boost wages and subsequently raise prices for consumers.

Central bankers believe that the price pressures are transitory, representing temporary shocks associated with the reopening of the economy. Lumber prices, for example, spiked when demand for new homes returned and have since normalized (see the chart below). To be sure, above-target inflation has heightened uncertainty. The central banks do not want to choke off the economic recovery through misplaced inflation fears. Many Canadians remain out of work, and long-term unemployment is still very high. Moreover, the recent surge of the delta variant proves that the recovery is uncertain.

Governor Tiff Macklem, whose latest forecasts show inflation creeping up to 3.9% in the third quarter before easing at the end of the year, has warned against overreacting to the “temporary” spike.

Shelter Prices Rising Fastest

Prices rose faster year over year in six of the eight major components of Canadian inflation in July, with shelter prices contributing the most to the all-items increase. Conversely, prices for clothing and footwear and alcoholic beverages, tobacco products and recreational cannabis slowed on a year-over-year basis in July compared with June.
Year over year, gasoline prices rose less in July (+30.9%) than in June (+32.0%). A base-year effect continued to impact the gasoline index, as prices in July 2020 increased 4.4% on a month-over-month basis when many businesses and services reopened.

In July 2021, gasoline prices increased 3.5% month over month, as oil production by OPEC+ (countries from the Organization of Petroleum Exporting Countries Plus) remained below pre-pandemic levels though global demand increased.

The homeowners’ replacement cost index, which is related to the price of new homes, continued to trend upward, rising 13.8% year over year in July, the largest yearly increase since October 1987.

Similarly, the other owned accommodation expenses index, which includes commission fees on the sale of real estate, was up 13.4% year over year in July.

Year-over-year price growth for goods rose at a faster pace in July (+5.0%) than in June (+4.5%), with durable goods (+5.0%) accelerating the most. The purchase of passenger vehicles index contributed the most to the increase, rising 5.5% year over year in July. The gain was partially attributable to the global shortage of semiconductor chips.

Prices for upholstered furniture rose 13.4% year over year in July, largely due to lower supply and higher input costs.


Core Measures
The average of core inflation readings, a better gauge of underlying price pressures, rose to 2.47% in July, the highest since 2009.

Monthly, prices rose 0.6% versus a consensus estimate of 0.3%. Rising costs to own a home are one of the biggest contributors to the elevated inflation rate, following a surge in real-estate prices over the past year.

Bottom Line

Today’s inflation data likely did little to alter the Bank of Canada’s view that above-target inflation will be a transitory phenomenon. They are already ahead of most central banks in tapering the stimulus coming from quantitative easing. They do not expect to start increasing interest rates until the labour markets have returned to full employment, which they judge to occur in the second half of 2022. In the meantime, pent-up demand in Canada is huge as people tap into their involuntary savings during the lockdown to pay higher prices at restaurants, grocery stores and gas stations. Financial markets appear to be sanguine about the prospect for rate hikes, as bond yields have been trading in a very narrow range.

Dr. Sherry Cooper