AUGUST DATA CONFIRM THAT HOUSING HAS TURNED THE CORNER
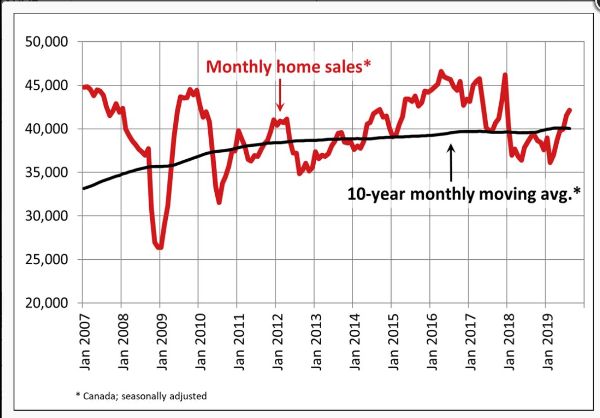
 Statistics released today by the Canadian Real Estate Association (CREA) show that national home sales rose for the sixth consecutive month. Transactions are now running almost 17% above the six-year low reached in February 2019, but remain about 10% below highs reached in 2016 and 2017. Toronto, Montreal and Vancouver all saw sales and prices rise. CREA updated its 2019 sales forecast, now predicting a 5% gain this year. Gains were led by a record-setting August in Winnipeg and a further improvement in the Fraser Valley. These confirm signs that the country’s housing market is returning to health.
Actual (not seasonally adjusted) sales activity was up 5% from where it stood in August 2018. The number of homes that traded hands was up from year-ago levels in most of Canada’s largest urban markets, including the Lower Mainland of British Columbia, Calgary, Winnipeg, the Greater Toronto (GTA), Ottawa and Montreal.
 New Listings
The number of newly listed homes rose 1.1% in August. With sales and new supply up by similar magnitudes, the national sales-to-new listings ratio was 60.1%—little changed from July’s reading of 60.0%. The measure has risen above its long-term average (of 53.6%) in recent months, which indicates a tighter balance between supply and demand and a growing potential for price gains.
Based on a comparison of the sales-to-new listings ratio with the long-term average, about three-quarters of all local markets were in balanced market territory in August 2019. Of the remainder, the ratio was above the long-term average in all markets save for some in the Prairie region.
There were 4.6 months of inventory on a national basis at the end of August 2019 – the lowest level since December 2017. This measure of market balance has been increasingly retreating below its long-term average (of 5.3 months).
There is considerable regional variation in the tightness of housing markets. The number of months of inventory has swollen far beyond long-term averages in Prairie provinces and Newfoundland & Labrador, giving homebuyers an ample choice in these regions. By contrast, the measure is running well below long-term averages in Ontario, Quebec and Maritime provinces, resulting in increased competition among buyers for listings and fertile ground for price gains. Meanwhile, the measure is well centred in balanced-market territory in the Lower Mainland of British Columbia, making it likely that prices there will stabilize.
Home Prices
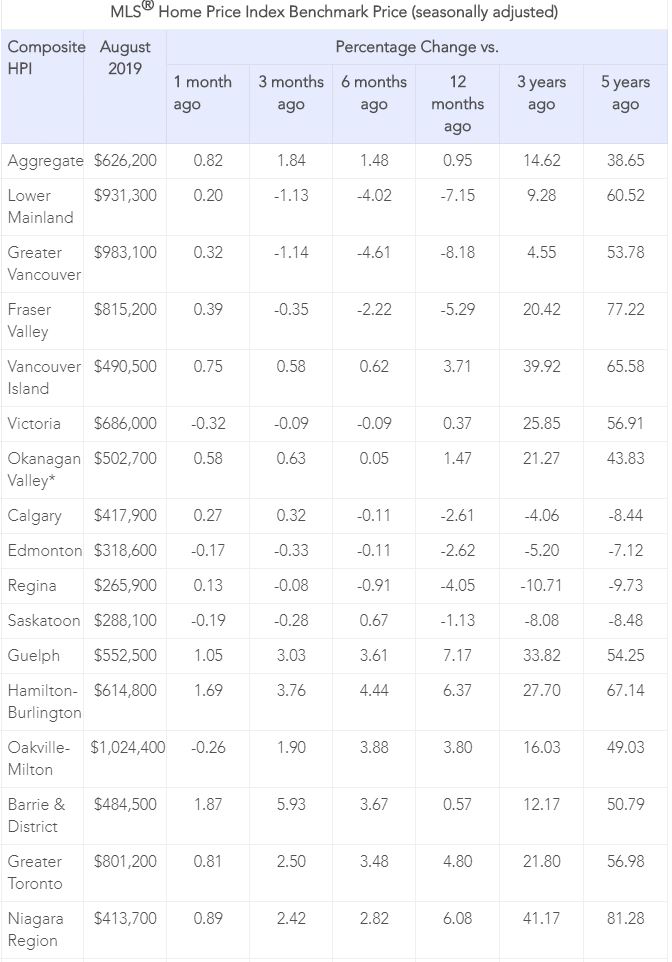
Canadian home prices saw its biggest one-month gain in two years. The Aggregate Composite MLS® Home Price Index (MLS® HPI) rose 0.8% m-o-m in August 2019.
Seasonally adjusted MLS® HPI readings in August were up from the previous month in 14 of the 18 markets tracked by the index, marking the biggest dispersion of monthly price gains since last March.
In recent months, home prices have generally been stabilizing in British Columbia and the Prairies, a measure which had been falling until recently. Meanwhile, price growth has begun to rebound among markets in the Greater Golden Horseshoe (GGH) region amid ongoing price gains in housing markets east of it.
A comparison of home prices to year-ago levels yields considerable variations across the country, with declines in western Canada and price gains in eastern Canada.
The actual (not seasonally adjusted) Aggregate Composite MLS® (HPI) was up 0.9% year-over-year (y/y) in August 2019. This marks the second consecutive month in which prices climbed above year-ago levels and the most substantial y/y increase since the end of last year.
Home prices in Greater Vancouver (GVA) and the Fraser Valley remain furthest below year-ago levels, (-8.3% and -5.5%, respectively). Vancouver Island and the Okanagan Valley logged y/y increases of 3.7% and 1.5% respectively.
Prairie markets posted modest price declines, while y-o-y price growth has re-accelerated ahead of overall consumer price inflation across most of the GGH. Meanwhile, price growth has continued uninterrupted for the last few years in Ottawa, Montreal and Moncton.
All benchmark home categories tracked by the index returned to positive y/y territory in August. Two-storey single-family home prices were up most, rising 1.2% y/y. This category of homes had .been hardest hit during the slump. One-storey single-family home prices rose 0.7% y/y, while townhouse/row and condo apartment units edged up 0.3% and 0.5%, respectively.
Stress Test
Canada’s introduction of stricter mortgage-lending rules last year inhibited some potential home buyers. Until recently, declining interest rates and lower home prices may have allowed some of those buyers to return to the market, according to the CREA report.
“The recent marginal decline in the benchmark five-year interest rate used to assess homebuyers’ mortgage eligibility–from 5.34% to 5.19%–together with lower home prices in some markets, means that some previously sidelined homebuyers have returned,” said Gregory Klump, CREA’s chief economist. “Even so, the mortgage stress-test will continue to limit homebuyers’ access to mortgage financing, with the degree to which it further weighs on home sales activity continuing to vary by region.”
CREA also updated its forecasts. National home sales are now projected to recover to 482,000 units in 2019, representing a 5% increase from the five-year low recorded in 2018. The upward revision of 19,000 transactions brings the overall level back to the 10-year average, but remains well below the annual record set in 2016, when almost 540,000 homes traded hands, CREA said.
Bottom Line: This report is in line with other recent indicators that suggest housing has recovered from a slump earlier, helped by falling mortgage rates. The run of robust housing data gives the Bank of Canada another reason — along with robust job gains, higher wage rates and stronger than expected output growth in Q2 — to hold interest rates steady, even as more than 30 central banks around the world have cut interest rates further.
The Federal Open Market Committee meets again on Wednesday, and it is widely expected that they will cut rates by 25 basis points as the White House is calling for “emergency easing moves.” The Trump administration has just in the past few days succumbed to political pressure to reduce trade tensions. Trade uncertainty is the only thing right now that would derail the Canadian recovery.
As a result of this recent easing in trade tensions and last week’s cut in overnight rates further into negative territory by the European Central Bank, the flight to US Treasury bond safety diminished, raising the US and Canadian government bond yields by roughly 25 basis points from extremely low levels. Canadian 5-year bond yields at 1.48% are at their highest level in two months. In consequence, the spread between the best 5-year fixed mortgage rates and 5-year government bonds is at a very tight 77 basis points, which is likely not sustainable. A more normal spread between the two is 120-ish (or more) for the best rates and 150-plus-ish (for regular rates). Some lenders are already hiking mortgage rates.
The situation has been compounded with even more considerable uncertainty with the weekend bombing of the Saudi Aramco oil fields, taking an estimated half of all Saudi oil out of production. Stay tuned.
